Using the Analytic Hierarchy Process (AHP) to Select and Prioritize Projects in a Portfolio
Publications
PMI Global Congress 2010 – North America
Washington – DC – USA – 2010
Russian Project Management Conference
(Русская конференция Управление проектами)
Moscow – Russia Federation – 2010
Abstract
The objective of this paper is to present, discuss and apply the principles and techniques of the Analytic Hierarchy Process (AHP) in the prioritization and selection of projects in a portfolio. AHP is one of the main mathematical models currently available to support the decision theory.
When looking into how organizations decide over which projects to execute, we can notice a constant desire to have a clear, objective, and mathematical criteria (HAAS & MEIXNER, 2005). However, decision-making is, in its totality, a cognitive and mental process derived from the most possible adequate selection based on tangible and intangible criteria (SAATY, 2009), which are arbitrarily chosen by those who make the decisions.
This paper also discusses the importance and some possible criteria for prioritizing projects, and by using a fictitious project prioritization example, it demonstrates AHP in a step-by-step manner, where the resulting priorities are shown and the possible inconsistencies are determined.
The importance of project selection and prioritization
One of the main challenges that organizations face today resides in their ability to choose the most correct and consistent alternatives in such a way that strategic alignment is maintained. Given any specific situation, making the right decisions is probably one of the most difficult challenges for science and technology (TRIANTAPHYLLOU, 2002).
When we consider the ever-changing dynamics of the current environment as we have never seen before, making the right choices based on adequate and aligned objectives constitutes a critical factor, even for organizational survival.
Basically, the prioritization of projects in a portfolio is nothing more than an ordering scheme based on a benefit-cost relationship of each project. Projects with higher benefits, when compared to their costs, will have a higher priority. It’s important to observe that a benefit-cost relationship does not necessarily mean the use of exclusive financial criteria like the widely known benefit-cost ratio, but instead a broader concept of the reaped benefits from executing the project and their related efforts.
Since organizations belong to a complex and varying context, oftentimes even chaotic, the challenge of the aforementioned definition resides exactly in determining what are costs and benefits to any given organization.
Possible Definitions for Low Costs | Possible Definitions for High Benefits |
Cheaper | More profitable |
Fewer resource needs | Greater return of investment |
Easier to be executed | Increase in the number of customers |
Less complex | Increase in competitiveness |
Less internal resistance | Improvements for the society |
Less bureaucratic | Increase in Market Share |
Fewer risks (threats) | Executives and shareholders happier |
When analyzing the above table, one can observe that the different dimensions demonstrate how complex it is to come up with an exact translation for the meaning of low cost and high benefits. That is the reason why a unique criterion or translation is not viable enough to determine which project(s) should or should not be executed. Thus it is necessary to employ a multi-criteria analysis (TRIANTAPHYLLOU, 2002) which allows for decisions while taking into consideration the different dimensions and organizational needs altogether.
PMI’s Standard for Portfolio Management (PMI, 2008) says that the scope of a project portfolio must stem from the strategic objectives of the organization. These objectives must be aligned with the business scenario which in turn may be different for each organization. Consequently, there is no perfect model that covers the right criteria to be used for any type of organization when prioritizing and selecting its projects. The criteria to be used by the organization should be based on the values and preferences of its decision-makers.
Current criteria used in the prioritization of projects
Although decisions are based on the values and preferences of the decision-makers, a set of criteria or specific objectives can be used while prioritizing projects and determining the real meaning of an optimal relationship between benefits and costs.
The main criteria groups are:
Financial – A group of criteria with the objective of capturing the financial benefits of projects. They are directly associated with costs, productivity, and profit measures. A few examples are:
- Return on Investment (ROI) – It is the percentage of the profit margin of the project. It allows comparing the financial return of projects with different investments and profits.
- Profit (currency) – The value (in currency) of the financial profit gained by the project. A project may have a smaller ROI but its nominal profit can be bigger.
- Net Present Value (NPV) – It is the difference between the project benefits and costs taking into consideration that all incomes and expenses are converted to be realized in the current date. In order to do so, it is necessary to bring all future values to the current date by using a given interest rate. That allows the assessment and comparison between projects which have future incomes and expenses from different time periods.
- Payback – It is the number of time in periods necessary to recover all of the original project investments.
- Financial Benefit / Cost Rate – It is the ratio between the present value of the benefits and the present value of the costs. The higher the ratio, the more viable is the project from the perspective of benefit/costs.
Strategic – A group of criteria directly associated with the strategic objectives of the organization. The strategic criteria/objectives are determined by methods used to cascade corporate strategy like the Balanced Scorecard. They differ from the financial criteria because strategic criteria are specific for any organization. Organizations with different strategies will certainly have different prioritization criteria. Some examples may be to increase the capacity to compete in international markets, to use eco-friendly practices, to optimize internal processes, to cut expenses in comparison with benchmarking competitors, to improve the reputation of products and services, etc.
Risks (Threats) – It determines the level of risk tolerance that an organization accepts to execute a project. The threat-based risk assessment criteria can also incorporate the assessment of opportunities (HILSON, 2003). However, oftentimes the assessment of opportunities that a project can yield is already covered and taken care of by the strategic criteria. Another equally possible perspective for this criterion entangles the organizational risk of not undertaking the project.
Urgency – It determines the urgency level of the project. Projects considered to be urgent require immediate decision and action, and so they have a higher priority than projects that are not urgent.
Stakeholder commitment – A group of criteria that aims to assess the level of stakeholder commitment towards the project. The higher the commitment to the project, the higher priority the project receives. The commitment may be assessed in a broad manner where all stakeholders are considered as a unique group, or it can be decomposed into different stakeholder groups, like for example:
- Customer commitment
- Community commitment
- Organizational commitment
- Regulatory bodies
- Project team commitment
- Project manager commitment
Technical Knowledge – It assesses the technical knowledge necessary to execute the project. The more technical knowledge readily available, the easier will it be to execute any given project, and, consequently, it will cause the project to use fewer resources. It is important to note that, if it is necessary to establish criteria or objectives related to the learning and growth process, these criteria need to be associated with the organization’s strategic criteria, and not with any technical knowledge.
Analytic Hierarchy Process
The multi-criteria programming made through the use of the Analytic Hierarchy Process is a technique for decision making in complex environments where many variables or criteria are considered in the prioritization and selection of alternatives or projects.
AHP was developed in the ’70s by Thomas L. Saaty and has been since then extensively studied, being currently used in decision-making for complex scenarios, where people work together to make decisions when human perceptions, judgments, and consequences have a long term repercussion (BHUSHAN & RAI, 2004).
The application of AHP begins with a problem being decomposed into a hierarchy of criteria so as to be more easily analyzed and compared in an independent manner (Figure 1). After this logical hierarchy is constructed, the decision-makers can systematically assess the alternatives by making pairwise comparisons for each of the chosen criteria. This comparison may use concrete data from the alternatives or human judgments as a way to input subjacent information (SAATY, 2008).
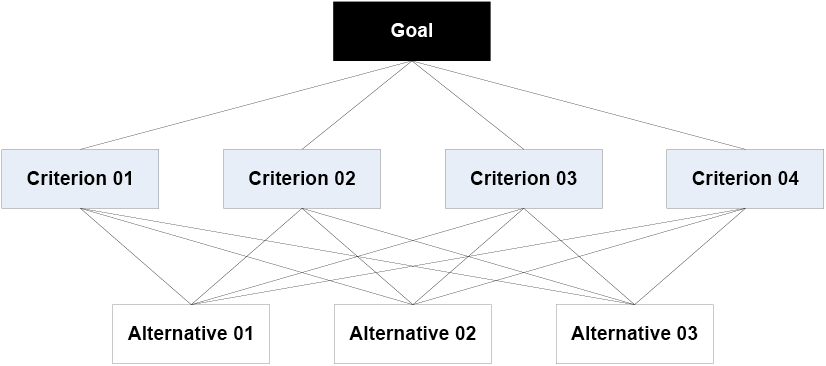 Figure 1 – Example of a hierarchy of criteria/objectives
AHP transforms the comparisons, which are most of the time empirical, into numeric values that are further processed and compared. The weight of each factor allows the assessment of each one of the elements inside the defined hierarchy. This capability of converting empirical data into mathematical models is the main distinctive contribution of the AHP technique when contrasted to other comparing techniques.
After all, comparisons have been made, and the relative weights between each one of the criteria to be evaluated have been established, the numerical probability of each alternative is calculated. This probability determines the likelihood that the alternative has to fulfill the expected goal. The higher the probability, the better chances the alternative has to satisfy the final goal of the portfolio.
The mathematical calculation involved in the AHP process may at first seem simple, but when dealing with more complex cases, the analyses and calculations become deeper and more exhaustive.
The comparison scale (Saaty scale)
The comparison between two elements using AHP can be done in different ways (TRIANTAPHYLLOU & MANN, 1995). However, the relative importance scale between two alternatives suggested by Saaty (SAATY, 2005) is the most widely used. Attributing values that vary from 1 to 9, the scale determines the relative importance of an alternative when compared to another alternative, as we can see in Table 1.
Scale | Numerical Rating | Reciprocal |
Table 1 – Saaty’s Scale of Relative Importance (SAATY, 2005) | ||
Extremely Preferred | 9 | 1/9 |
Very strong to extremely | 8 | 1/8 |
Very strongly preferred | 7 | 1/7 |
Strongly to very strongly | 6 | 1/6 |
Strongly preferred | 5 | 1/5 |
Moderately to strongly | 4 | ¼ |
Moderately preferred | 3 | 1/3 |
Equally to moderately | 2 | ½ |
Equally preferred | 1 | 1 |
It is common to always use odd numbers from the table to make sure there is a reasonable distinction among the measurement points. The use of even numbers should only be adopted if there is a need for negotiation between the evaluators. When a natural consensus cannot be reached, it raises the need to determine a middle point as the negotiated solution (compromise) (SAATY, 1980).
The comparison matrix is constructed from the Saaty scale (Table 2).
Criteria 1 | Criteria 2 | |
Table 2 – Comparison Matrix (presuming that Criterion 1 dominates over Criterion 2) | ||
Criteria 1 | 1 | Numerical Rating |
Criteria 2 | 1/Numerical Rating (Reciprocal) | 1 |
An example of the application of AHP in a portfolio
In order to serve as an example of the AHP calculations for prioritization of projects, the development of a fictitious decision model for the ACME Organization has been chosen. As the example is further developed, the concepts, terms, and approaches to AHP will be discussed and analyzed.
The first step to building the AHP model lies in the determination of the criteria that will be used. As already mentioned, each organization develops and structures its own set of criteria, which in turn must be aligned to the strategic objectives of the organization.
For our fictitious ACME organization, we will assume that a study has been made together with the Finance, Strategy Planning, and Project Management areas on the criteria to be used. The following set of 12 (twelve) criteria has been accepted and grouped into 4 (four) categories, as shown on the hierarchy depicted in Figure 2.
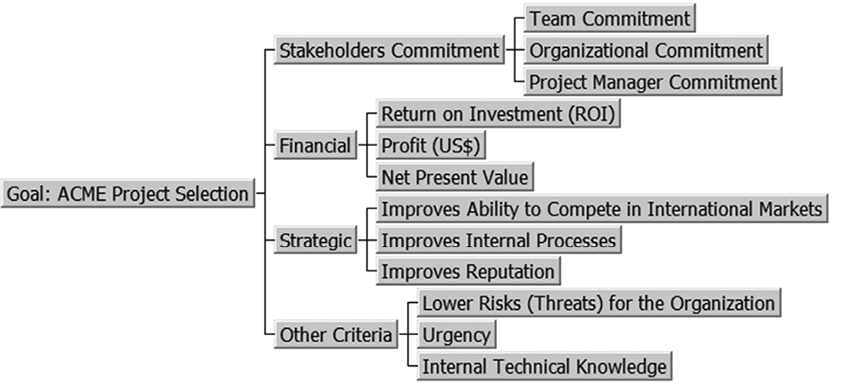 Figure 2 – Hierarchy of Criteria for the fictitious ACME organization
Determining the comparison matrix, the priority vector (Eigen), and the inconsistency
After the hierarchy has been established, the criteria must be evaluated in pairs so as to determine the relative importance between them and their relative weight to the global goal.
The evaluation begins by determining the relative weight of the initial criteria groups (Figure 3). Table 3 shows the relative weight data between the criteria that have been determined by ACME’s decision-makers.

Figure 3 – ACME’s initial group of criteria/objectives
Stakeholders C | Financial | Strategic | Other Criteria | |
Table 3 – Comparison Matrix for ACME’s Group of Criteria | ||||
Stakeholders C | 1 | 1/5 | 1/9 | 1 |
Financial | 5 | 1 | 1 | 5 |
Strategic | 9 | 1 | 1 | 5 |
Other Criteria | 1 | 1/5 | 1/5 | 1 |
In order to interpret and give relative weights to each criterion, it is necessary to normalize the previous comparison matrix. The normalization is made by dividing each table value by the total column value (Table 4).
Stakeholders C | Financial | Strategic | Other Criteria | |
Table 4 – Comparison Matrix for ACME’s Group of Criteria after Normalization | ||||
Stakeholders C | 1 | 1/5 | 1/9 | 1 |
Financial | 5 | 1 | 1 | 5 |
Strategic | 9 | 1 | 1 | 5 |
Other Criteria | 1 | 1/5 | 1/5 | 1 |
Total (Sum) | 16.00 | 2.40 | 2.31 | 12.00 |
Results | ||||
Stakeholders C | 1/16 = 0.063 | 0.083 | 0.048 | 0.083 |
Financial | 5/16 = 0,313 | 0.417 | 0.433 | 0.417 |
Strategic | 9/16 = 0.563 | 0.417 | 0.433 | 0.417 |
Other Criteria | 1/16 = 0.063 | 0.083 | 0.087 | 0.083 |
The contribution of each criterion to the organizational goal is determined by calculations made using the priority vector (or Eigenvector). The Eigenvector shows the relative weights between each criterion it is obtained in an approximate manner by calculating the arithmetic average of all criteria, as depicted in Exhibit 10. We can observe that the sum of all values from the vector is always equal to one (1).
The exact calculation of the Eigenvector is determined only in specific cases. This approximation is applied most of the time in order to simplify the calculation process since the difference between the exact value and the approximate value is less than 10% (KOSTLAN, 1991).
Eigenvector (Calculation) | Eigenvector | |
Table 5 – Eigenvector Calculation (ACME) | ||
Stakeholders C | [0.063+0.083+0.048+0.083]/4 =0.0693 | 0.0693 (6,93%) |
Financial | [0.313+0.417+0.433+0.417]/4 =0.3946 | 0.3946 (39,46%) |
Strategic | [0.563+0.417+0.433+0.417]/4 =0.4571 | 0.4571 (45,71%) |
Other Criteria | [0.063+0.083+0.087+0.083]/4 = 0.0789 | 0.0789 (7,89%) |
For comparison purposes, a mathematical software application has been used to calculate the exact value for the Eigenvector through the use of potential matrices. The results are shown on Table 6.
Approximate Eigen Vector | Exact Eigen Vector | Difference (%) | |
Table 6 – Comparative Results for the Calculation of the Eigenvector – Approximate and Exact | |||
Stakeholders C | 0.0693 (6,93%) | 0.0684 (6,84%) | 0,0009 (1,32%) |
Financial | 0.3946 (39,46%) | 0.3927 (39,27%) | 0,0019 (0,48%) |
Strategic | 0.4571 (45,71%) | 0.4604 (46,04%) | 0,0033 (0,72%) |
Other Criteria | 0.0789 (7,89%) | 0.0785 (7,85%) | 0,0004 (0,51%) |
It can be observed that the approximate and exact values are very close to each other, so the calculation of the exact vector requires a mathematical effort that can be exempted (KOSTLAN, 1991).
The values found in the Eigenvector have a direct physical meaning in AHP. They determine the participation or weight of that criterion relative to the total result of the goal. For example, in our ACME organization, the strategic criteria have a weight of 46.04% (exact calculation of the Eigenvector) relative to the total goal. A positive evaluation on this factor contributes approximately 7 (seven) times more than a positive evaluation on the Stakeholder Commitment criterion (weight 6.84%).
The next step is to look for any data inconsistencies. The objective is to capture enough information to determine whether the decision-makers have been consistent in their choices (TEKNOMO, 2006). For example, if the decision-makers affirm that the strategic criteria are more important than the financial criteria and that the financial criteria are more important than the stakeholder commitment criteria, it would be inconsistent to affirm that the stakeholder commitment criteria are more important than the strategic criteria (if A>B and B>C it would be inconsistent to say that A<C).
The inconsistency index is based on Maximum Eigenvalue, which is calculated by summing the product of each element in the Eigenvector (Table 5) by the respective column total of the original comparison matrix (Table 4). Table 7 demonstrates the calculation of Maximum Eigenvalue (λMax)1
1 The Eigenvector values used from this moment on will be based on the exact values, and not on the approximate values, because the exact values have been calculated and are thus available.
.
Table 7 – Calculation of Maximum Eigenvalue | ||||
Eigenvector | 0.0684 | 0.3927 | 0.4604 | 0.0785 |
Total (Sum) | 16.00 | 2.40 | 2.31 | 12.00 |
Maximum | [(0.0684 x 16.00)+(0.3927 x 2.40)+(0.4604 x 2.31) + (0.0785 x 12.00)] = 4.04 | |||

Where CI is the Consistency Index and n is the number of evaluated criteria.
For our ACME organization, the Consistency Index (CI) is
In order to verify whether the Consistency Index (CI) is adequate, Saaty (SAATY, 2005) suggests what has been called Consistency Rate (CR), which is
determined by the ratio between the Consistency Index and the Random Consistency Index (RI). The matrix will be considered consistent if the resulting ratio is less than 10%.
The calculation of the Consistency Index (SAATY, 2005) is given by the following formula

The RI value is fixed and is based on the number of evaluated criteria, as shown in Table 8.
Table 8 – Table of Random Consistency Indices (RI) (SAATY, 2005) | ||||||||||
N | 1 | 2 | 3 | 4 | 5 | 6 | 7 | 8 | 9 | 10 |
RI | 0 | 0 | 0.58 | 0.9 | 1.12 | 1.24 | 1.32 | 1.41 | 1.45 | 1.49 |
For our ACME organization, the Consistency Rate for the initial criteria group is

Since its value is less than 10%, the matrix can be considered to be consistent. The priority criteria results for the first level can be seen in Figure 4.
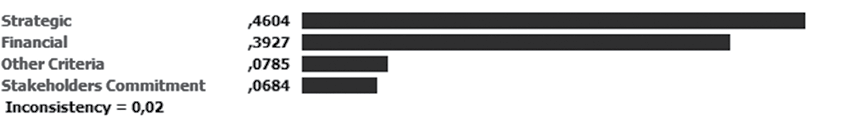 Figure 4 – Results of the Comparison Matrix for ACME’s Criteria Group, demonstrating the contribution of each criterion to the goal defined for the organization
By looking at Figure 4 and the Eigenvector values, it is evident that the Strategic Criteria have a contribution of 46.04% to the goal, whereas the Stakeholder Commitment criteria contribute 6.84% to the goal.
Other calculations involving the chosen criteria
Just like it was done with the initial criteria group for the ACME organization, it is necessary to evaluate the criteria’s relative weights for the second level of the hierarchy (Figure 5). This process is executed just like the step to evaluate the first level of the hierarchy (Criteria Group) as it was shown above.
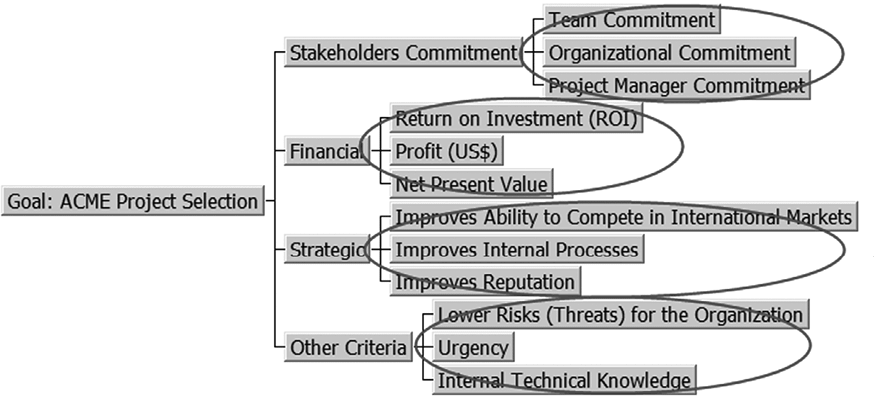 Figure 5 – Hierarchy of criteria for the fictitious ACME organization highlighting the second hierarchy level
The following tables (16 to 19) show the comparison matrices for the criteria with the pair-wise comparisons already taken by the decision-makers.
Stakeholders Commitment Criteria | |||
Table 9 – Comparison Matrix – Stakeholder Commitment Criteria | |||
Team Commitment | Organizational Commitment | Project Manager Commitment | |
Team Commitment | 1 | 3 | 1/5 |
Organizational Commitment | 1/3 | 1 | 1/9 |
Project Manager Commitment | 5 | 9 | 1 |
Financial Criteria | |||
Table 10 – Comparison Matrix – Financial Criteria | |||
Return of Investment | Profit (US$) | Net Present Value | |
Return of Investment | 1 | 1/5 | 1/5 |
Profit (US$) | 5 | 1 | 1 |
Net Present Value | 5 | 1 | 1 |
Strategic Criteria | |||
Table 11 – Comparison Matrix – Strategic Criteria | |||
Compete in International Markets | Internal Processes | Reputation | |
Compete in Intern. Markets | 1 | 7 | 3 |
Internal Processes | 1/7 | 1 | 1/5 |
Reputation | 1/3 | 5 | 1 |
Other Criteria | |||
Table 12 – Comparison Matrix – Other Criteria | |||
Lower Risks for the Organization | Urgency | Internal Technical Knowledge | |
Lower Risks for the Organization | 1 | 5 | 1/3 |
Urgency | 1/5 | 1 | 1/7 |
Internal Technical Knowledge | 3 | 7 | 1 |
The following charts (Figure 20 to 23) demonstrate the priority results for the sub-criteria for each one of the criteria groups2
2 The data have been simulated and calculated using ExpertChoice 11.5 for Windows, available at www.expertchoice.com
and their respective inconsistency indices. We can observe that none of the criteria demonstrates any inconsistency above tolerable limits.
 Figure 6 – Priority results for the Stakeholder Commitment Criteria
 Figure 7 – Priority results for the Financial Criteria
 Figure 8 – Priority results for the Strategic Criteria
 Figure 9 – Priority results for the Other Criteria
The global priority for each criterion is determined by the result of the multiplication of each priority on the first level by its respective priority on the second level. The results are shown on the hierarchy depicted on Figure 10. We can also see that the sum of the weights of all twelve (12) factors is equal to 1.
 Figure 10 – Hierarchy of criteria for the fictitious ACME organization with global priorities for each criterion
Evaluating candidate projects for the portfolio
After having structured the tree and established the priority criteria, it is now possible to determine how each one of the candidate projects fits the chosen criteria. In the same manner that the criteria prioritization has been made, the candidate projects are pair-wisely compared considering every established criterion.
For our ACME organization, six (6) different projects have been identified and must then be prioritized. The fictitious projects are:
- Move to a new office facility
- New ERP system
- Opening of an office in China
- Development of a new Product aiming at the International Market
- IT Infrastructure Outsourcing
- New local Marketing Campaign
- In order to apply AHP, the decision-makers from the ACME organization have compared six (6) projects taking into consideration every one of the twelve (12) established criteria. The results are shown in the following twelve (12) tables.
Team Commitment | ||||||
Table 13 – Projects Comparison Matrix for the Team Commitment Criterion | ||||||
New Office | ERP Implem. | Chinese Office | Intern. Product | IT Outsource | Local Campaign | |
New Office | 1 | 5 | 3 | 1/3 | 9 | 7 |
ERP Implementation | 1/5 | 1 | 1/5 | 1/7 | 1 | 1/3 |
Chinese Office | 1/3 | 5 | 1 | 1/3 | 7 | 3 |
International Product | 3 | 7 | 3 | 1 | 5 | 5 |
IT Outsourcing | 1/9 | 1 | 1/7 | 1/5 | 1 | 1/3 |
New Local Campaign | 1/7 | 3 | 1/3 | 1/5 | 3 | 1 |
Organizational Commitment | ||||||
Table 14 – Projects Comparison Matrix for the Organization Commitment Criterion | ||||||
New Office | ERP Implem. | Chinese Office | Intern. Product | IT Outsource | Local Campaign | |
New Office | 1 | 3 | 1/9 | 1/5 | 5 | 3 |
ERP Implementation | 1/3 | 1 | 1/9 | 1/7 | 1 | 1/3 |
Chinese Office | 9 | 9 | 1 | 3 | 7 | 7 |
International Product | 5 | 7 | 1/3 | 1 | 9 | 7 |
IT Outsourcing | 1/5 | 1 | 1/7 | 1/9 | 1 | 1/3 |
New Local Campaign | 1/3 | 3 | 1/7 | 1/7 | 3 | 1 |
Project Manager Commitment | ||||||
Table 15 – Projects Comparison Matrix for the Project Manager Commitment Criterion | ||||||
New Office | ERP Implem. | Chinese Office | Intern. Product | IT Outsource | Local Campaign | |
New Office | 1 | 7 | 1/3 | 1/3 | 5 | 3 |
ERP Implementation | 1/7 | 1 | 1/9 | 1/7 | 3 | 1/3 |
Chinese Office | 3 | 9 | 1 | 1 | 7 | 7 |
International Product | 3 | 7 | 1 | 1 | 7 | 9 |
IT Outsourcing | 1/5 | 1/3 | 1/7 | 1/7 | 1 | 1/5 |
New Local Campaign | 1/3 | 3 | 1/7 | 1/9 | 5 | 1 |
Return on Investment | ||||||
Table 16 – Projects Comparison Matrix for the Return On Investment Criterion | ||||||
New Office | ERP Implem. | Chinese Office | Intern. Product | IT Outsource | Local Campaign | |
New Office | 1 | 1/3 | 1/7 | 1/9 | 1/3 | 1/3 |
ERP Implementation | 3 | 1 | 1/9 | 1/9 | 1/3 | 1/3 |
Chinese Office | 7 | 9 | 1 | 1/3 | 7 | 5 |
International Product | 9 | 9 | 3 | 1 | 7 | 5 |
IT Outsourcing | 3 | 3 | 1/7 | 1/7 | 1 | 1/3 |
New Local Campaign | 3 | 3 | 1/5 | 1/5 | 3 | 1 |
Profit (US$) | ||||||
Table 17 – Projects Comparison Matrix for the Profit (US$) Criterion | ||||||
New Office | ERP Implem. | Chinese Office | Intern. Product | IT Outsource | Local Campaign | |
New Office | 1 | 1 | 1/7 | 1/9 | 1/5 | 1/3 |
ERP Implementation | 1 | 1 | 1/7 | 1/9 | 1/3 | 1/5 |
Chinese Office | 7 | 7 | 1 | 1/3 | 7 | 5 |
International Product | 9 | 9 | 3 | 1 | 9 | 5 |
IT Outsourcing | 5 | 3 | 1/7 | 1/9 | 1 | 1/3 |
New Local Campaign | 3 | 5 | 1/5 | 1/5 | 3 | 1 |
Net Present Value | ||||||
Table 18 – Projects Comparison Matrix for the Net Present Value Criterion | ||||||
New Office | ERP Implem. | Chinese Office | Intern. Product | IT Outsource | Local Campaign | |
New Office | 1 | 1/3 | 1/5 | 1/7 | 1/3 | 1/3 |
ERP Implementation | 3 | 1 | 1/5 | 1/7 | 1 | 1/3 |
Chinese Office | 5 | 5 | 1 | 1/3 | 5 | 3 |
International Product | 7 | 7 | 3 | 1 | 5 | 7 |
IT Outsourcing | 3 | 1 | 1/5 | 1/5 | 1 | 1/3 |
New Local Campaign | 3 | 3 | 1/3 | 1/7 | 3 | 1 |
Improves Ability to Compete in International Markets | ||||||
Table 19 – Projects Comparison Matrix for the Ability to Compete in International Markets Criterion | ||||||
New Office | ERP Implem. | Chinese Office | Intern. Product | IT Outsource | Local Campaign | |
New Office | 1 | 3 | 1/9 | 1/7 | 5 | 5 |
ERP Implementation | 1/3 | 1 | 1/9 | 1/9 | 1/3 | 3 |
Chinese Office | 9 | 9 | 1 | 1 | 9 | 9 |
International Product | 7 | 9 | 1 | 1 | 9 | 9 |
IT Outsourcing | 1/5 | 3 | 1/9 | 1/9 | 1 | 3 |
New Local Campaign | 1/5 | 1/3 | 1/9 | 1/9 | 1/3 | 1 |
Improves Internal Processes | ||||||
Table 20 – Projects Comparison Matrix for the Improves Internal Processes Criterion | ||||||
New Office | ERP Implem. | Chinese Office | Intern. Product | IT Outsource | Local Campaign | |
New Office | 1 | 1/5 | 3 | 5 | 1 | 7 |
ERP Implementation | 5 | 1 | 7 | 7 | 1 | 7 |
Chinese Office | 1/3 | 1/7 | 1 | 1 | 1/7 | 1 |
International Product | 1/5 | 1/7 | 1 | 1 | 1/7 | 1/3 |
IT Outsourcing | 1 | 1 | 7 | 7 | 1 | 7 |
New Local Campaign | 1/7 | 1/7 | 1 | 3 | 1/7 | 1 |
Improves Reputation | ||||||
Table 21 – Projects Comparison Matrix for the Improves Reputation Criterion | ||||||
New Office | ERP Implem. | Chinese Office | Intern. Product | IT Outsource | Local Campaign | |
New Office | 1 | 1/3 | 1/7 | 1/5 | 3 | 1/7 |
ERP Implementation | 3 | 1 | 1/9 | 1/5 | 5 | 1/7 |
Chinese Office | 7 | 9 | 1 | 3 | 7 | 1 |
International Product | 5 | 5 | 1/3 | 1 | 7 | 1/3 |
IT Outsourcing | 1/3 | 1/5 | 1/7 | 1/7 | 1 | 1/9 |
New Local Campaign | 7 | 7 | 1 | 3 | 9 | 1 |
Lower Risks (Threats) for the Organization | ||||||
Table 22 – Projects Comparison Matrix for the Lower Risks (Threats) for the Organization Criterion | ||||||
New Office | ERP Implem. | Chinese Office | Intern. Product | IT Outsource | Local Campaign | |
New Office | 1 | 5 | 7 | 3 | 5 | 1 |
ERP Implementation | 1/5 | 1 | 5 | 3 | 3 | 1/7 |
Chinese Office | 1/7 | 1/5 | 1 | 1/3 | 1/3 | 1/9 |
International Product | 1/3 | 1/3 | 3 | 1 | 5 | 1/7 |
IT Outsourcing | 1/5 | 1/3 | 3 | 1/5 | 1 | 1/9 |
New Local Campaign | 1 | 7 | 9 | 7 | 9 | 1 |
Urgency | ||||||
Table 23 – Projects Comparison Matrix for the Urgency Criterion | ||||||
New Office | ERP Implem. | Chinese Office | Intern. Product | IT Outsource | Local Campaign | |
New Office | 1 | 1/3 | 1/5 | 1/7 | 3 | 1 |
ERP Implementation | 3 | 1 | 1/7 | 1/9 | 3 | 3 |
Chinese Office | 5 | 7 | 1 | 1/3 | 5 | 7 |
International Product | 7 | 9 | 3 | 1 | 7 | 7 |
IT Outsourcing | 1/3 | 1/3 | 1/5 | 1/7 | 1 | 1/3 |
New Local Campaign | 1 | 1/3 | 1/7 | 1/7 | 3 | 1 |
Internal Technical Knowledge | ||||||
Table 24 – Projects Comparison Matrix for the Internal Technical Knowledge Criterion | ||||||
New Office | ERP Implem. | Chinese Office | Intern. Product | IT Outsource | Local Campaign | |
New Office | 1 | 9 | 9 | 9 | 9 | 3 |
ERP Implementation | 1/9 | 1 | 1/3 | 1/3 | 1/5 | 1/9 |
Chinese Office | 1/9 | 3 | 1 | 3 | 1 | 1/9 |
International Product | 1/9 | 3 | 1/3 | 1 | 1/3 | 1/9 |
IT Outsourcing | 1/9 | 5 | 1 | 3 | 1 | 1/9 |
New Local Campaign | 1/3 | 9 | 9 | 9 | 9 | 1 |
After calculating all priorities and inconsistency indices, it is possible to determine the relative weight of each project for each criterion, as we can see in the following twelve (12) charts (one chart for each criterion).
 Figure 11 – Priority results for the projects according to the Team Commitment Criterion
 Figure 12 – Priority results for the projects according to the Organization Commitment Criterion
 Figure 13 – Priority results for the projects according to the Project Manager Commitment Criterion
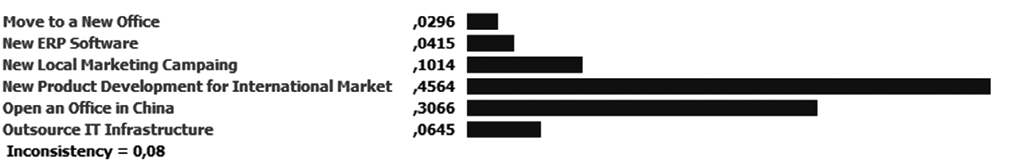 Figure 14 – Priority results for the projects according to the Return On Investment Criterion
 Figure 15 – Priority results for the projects according to the Profit (US$) Criterion
 Figure 16 – Priority results for the projects according to the Net Present Value Criterion
 Figure 17 – Priority results for the projects according to the Ability to compete in International Markets Criterion
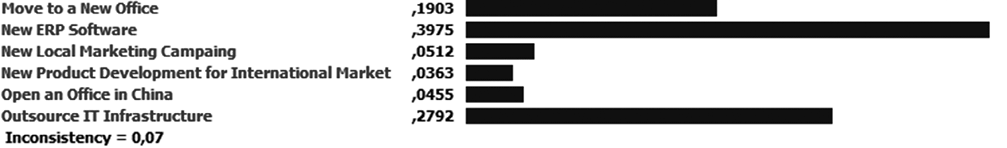 Figure 18 – Priority results for the projects according to the Improves Internal Processes Criterion
 Figure 19 –Priority results for the projects according to the Improves Reputation Criterion
 Figure 20 – Priority results for the projects according to the Lower Organizational Risks (Threats) Criterion
 Figure 21 – Priority results for the projects according to the Urgency Criterion
 Figure 22 – Priority results for the projects according to the Internal Technical Knowledge Criterion
The crossing product of all project evaluations using all criteria determines the final priority for each project in relation to the desired goal.
The mechanism for calculating the final priority is to sum the products of the multiplication of each criterion’s priority weight by its alternative weight.
In order to exemplify this process, Table 25 shows the calculation process for the alternative “Move to a New Office”
Criteria | Priority Weight | Alternative Weight | Product |
Table 25 – Final priority evaluation of the Project Move to a New Office according to the established and weighted criteria for the ACME Organization | |||
Team Commitment | 0,0122 | 0,2968 | 0,0036 |
Organizational Commitment | 0,0048 | 0,0993 | 0,0005 |
Project Manager Commitment | 0,0514 | 0,1586 | 0,0082 |
Return on Investment (ROI) | 0,0357 | 0,0296 | 0,0011 |
Profit (US$) | 0,1785 | 0,0315 | 0,0056 |
Net Present Value | 0,1785 | 0,0366 | 0,0065 |
Improves Ability to Compete in International Markets | 0,2988 | 0,1033 | 0,0309 |
Improves Internal Processes | 0,0331 | 0,1903 | 0,0063 |
Improves Reputation | 0,1284 | 0,0421 | 0,0054 |
Lower Risks (Threats) for the Organization | 0,0219 | 0,2994 | 0,0066 |
Urgency | 0,0056 | 0,0553 | 0,0003 |
Internal Technical Knowledge | 0,0510 | 0,4796 | 0,0243 |
Results | 0,0992 | ||
The same process should be repeated for the other five (5) projects. The final results for all projects are shown in Figure 23.
 Figure 23 – Final priority results for ACME’s portfolio of projects
Figure 23 shows that the project with the highest level of adherence to the defined goal is “Development of a New Product for the International Market”. It contributes with 34.39% (0.3439). In order to better illustrate the importance of the difference between the weights and priorities of each project, this project contributes about three (3) times more to the goal than the New Local Marketing Campaign project, which contributes with only 13.1% (0.131) to the global goal.
Conclusion
AHP has been attracting the interest of many researchers mainly due to the mathematical features of the method and the fact that data entry is fairly simple to be produced (TRIANTAPHYLLOU & MANN, 1995). Its simplicity is characterized by the pair-wise comparison of the alternatives according to specific criteria (VARGAS, 1990).
Its application to select projects for the portfolio allows the decision-makers to have a specific and mathematical decision support tool. This tool not only supports and qualifies the decisions but also enables the decision-makers to justify their choices, as well as simulate possible results.
The use of AHP also presumes the utilization of a software application tailored specifically to perform mathematical calculations. In this paper, the intention has been to show the main calculations performed during the analysis, enabling project managers to have an adequate understanding of the technique, as well as the complexity involved to make the calculations by hand (in case software applications can’t be used).
Another important aspect is the quality of the evaluations made by the decision-makers (COYLE, 2004). For a decision to be the most adequate possible, it must be consistent and coherent with organizational results. We saw that the coherence of the results can be calculated by the inconsistency index. However, the inconsistency index allows only the evaluation of the consistency and regularity of the opinions from the decision-makers, and not whether these opinions are the most adequate for a specific organizational context.
Finally, it is important to emphasize that decision-making presumes a broader and more complex understanding of the context than the use of any specific technique. It predicates that a decision about a portfolio is a fruit of negotiation, human aspects, and strategic analysis, where methods like AHP favor and guide the execution of the work, but they cannot and must not be used as a universal criterion.
References
BHUSHAN, N. & RAI, K. (2004). Strategic Decision Making: Applying the Analytic Hierarchy Process. New York: Springer.
COYLE, G. (2004). The Analytic Hierarchy Process. New York: Pearson Educational.
HAAS, R. & MEIXNER, O. (2005). An Illustrated Guide To Analytic Hierarchy Process. Vienna: University of Natural Resources and Applied Life Sciences.
KOSTLAN, E. (1991). Statistical Complexity of Dominant Eigenvector Calculation. Hawaii: Journal of Complexity Volume 7, Issue 4, December 1991, Pages 371-379. Available at http://www.developmentserver.com/randompolynomials/scdec/paper.pdf
HILLSON, D. (2002). Use a Risk Breakdown Structure (RBS) to Understand Your Risks. San Antonio: PMI Global Congress and Symposium.
PMI (2008). The Standard for Portfolio Management: Second Edition. Newtown Square: Project Management Institute.
SAATY, T. L (1980). The Analytic Hierarchy Process. New York: McGraw-Hill International.
SAATY, T. L. (2005). Theory and Applications of the Analytic Network Process: Decision Making with Benefits, Opportunities, Costs, and Risks. Pittsburgh: RWS Publications.
SAATY, T. L. (2008). Relative Measurement and its Generalization in Decision Making: Why Pairwise Comparisons are Central in Mathematics for the Measurement of Intangible Factors – The Analytic Hierarchy/Network Process. Madrid: Review of the Royal Spanish Academy of Sciences, Series A, Mathematics. Available at http://www.rac.es/ficheros/doc/00576.PDF
SAATY, T. L. (2009). Extending the Measurement of Tangibles to Intangibles. International Journal of Information Technology & Decision Making, Vol. 8, No. 1, pp. 7-27, 2009. Available at SSRN: http://ssrn.com/abstract=1483438
TEKNOMO, K. (2006). Analytic Hierarchy Process (AHP) Tutorial. Available at: https://people.revoledu.com/kardi/tutorial/AHP/purchase.html
TRIANTAPHYLLOU, E. & MANN S. H. (1995). Using The Analytic Hierarchy Process For Decision Making in Engineering Applications: Some Challenges. International Journal of Industrial Engineering: Applications and Practice, Vol. 2, No. 1, pp. 35-44, 1995. Available at http://www.csc.lsu.edu/trianta/Journal_PAPERS1/AHPapls1.pdf
TRIANTAPHYLLOU, E. (2002). Multi-Criteria Decision Making Methods: A Comparative Study. New York: Springer.
VARGAS, L.G. (1990). An Overview of the Analytic Hierarchy Process and its Applications. European Journal of Operational Research, 48, 2-8.
AHP (Analytic Hierarchy Process) , Portfolio Management